Bitcoin attack mode: BTC set for $150k after post-halving consolidation
After weeks of appearing to consolidate, Bitcoin (BTC) aims to establish its price above the crucial resistance level of $70,000.
Indeed, if the crypto manages to sustain the current bullish momentum, the market anticipates that it will rally to a new record high, possibly above $100,000.
Consequently, crypto trading expert TradingShot noted in a TradingView post on May 23 that Bitcoin is forecasted to enter a new rally phase following a period of consolidation post-halving. This development aligns with historical patterns in previous Bitcoin cycles, signaling a potential surge towards $150,000.
Picks for you
For instance, TradingShot noted the consistent occurrence of a two-month consolidation phase before and after the halving event, a pattern observed in past Bitcoin cycles. This consolidation phase typically precedes a significant rally in Bitcoin’s price.
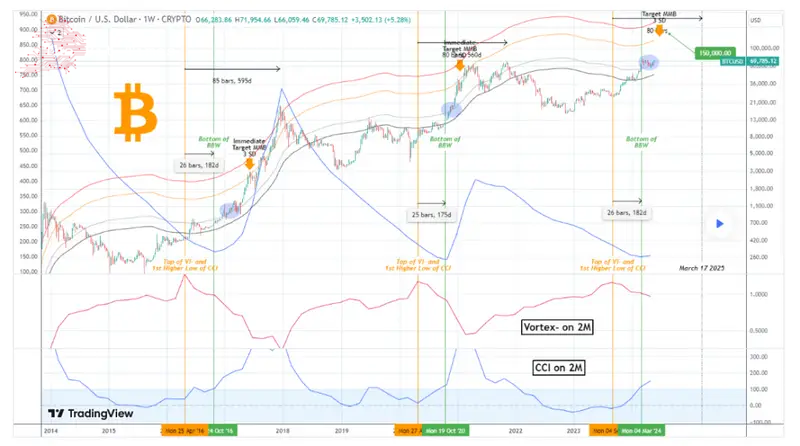
Moreover, the expert also reviewed the impact of technical indicators such as the Mayer Multiple Band (MMB) and the Bollinger Bands Width (BBW). TradingShot suggested that trading above the MMB of 1 Standard Deviation (SD) indicates a bullish trend, particularly after the BBW bottoms out. A surge has historically followed this pattern in Bitcoin’s price towards the MMB 3SD level.
Bitcoin’s next price target
The Vortex Indicator (VI) and the Commodity Channel Index (CCI) in the two-month time frame also highlight the symmetry in Bitcoin’s cycles. TradingShot’s analysis indicated that VI tops coincide with CCI’s first higher low after a bottom, suggesting a predictable pattern in Bitcoin’s price movements.
“As a result, we can expect the price to top by the week of March 17 2025 the earliest. <…> The most important part perhaps is that after each consolidation after the BBW bottom. Bitcoin’s immediate target was the MMB 3SD, which is the orange trend-line. That is currently at $125k but by the time the rally reaches it, it could be closer to $150k,” the analyst said.
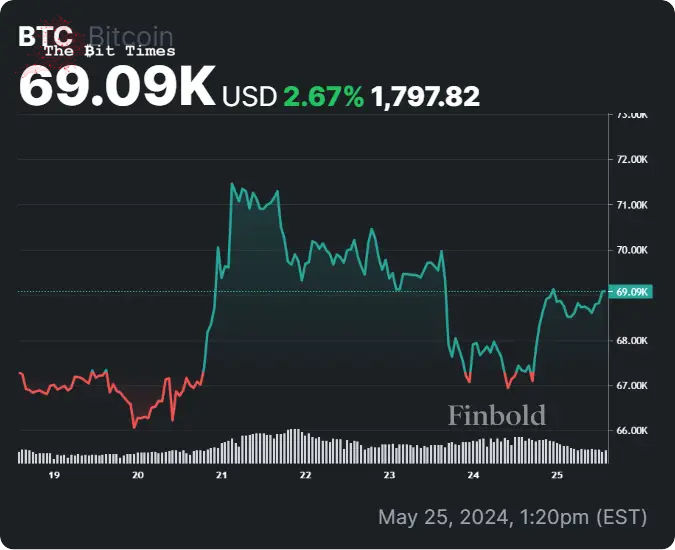
It’s worth noting that Bitcoin has exhibited bullish sentiments in the short term, with the crypto hitting the $71,000 mark on May 21. The rally coincided with a significant surge in spot buying and spot Bitcoin exchange-traded fund (ETF) purchasing.
As things stand, the market seems to be on edge regarding the implications of the current price movement. Some believe the recent bull run has peaked, while others suggest that a new bull run consistent with the Bitcoin post-halving price movement has begun.
Bitcoin price analysis
By press time, Bitcoin was trading at $69,103 with daily gains of almost 2.5%. On the weekly chart, BTC is up 2.67%.
Elsewhere, Bitcoin’s technical Analysis is dominated by bullish sentiments. According to data retrieved from TradingView, a summary of Bitcoin’s one-day gauges indicates a ‘buy’ at 15, while moving averages are at ‘strong buy’ at 14. Oscillators, on the other hand, are ‘neutral’ at 9.

Overall, most of the market anticipates that Bitcoin will sustain its current momentum, but a continuation of the rally significantly hinges on breaching the $70,000 resistance zone.
Disclaimer: The content on this site should not be considered investment advice. Investing is speculative. When investing, your capital is at risk.
Comments
Post a Comment