Bitcoin’s six-month stagnation echoes 2023’s price doldrums
Bitcoin (BTC) has been experiencing a period of consolidation, hovering above $63,000 after facing resistance at the $70,000 mark. This stagnation is not new, as it mirrors similar trends observed in past bull markets.
Crypto trading expert Rekt Capital suggests that while Bitcoin has the potential for a breakout, it might continue to consolidate for several more months, echoing the behavior seen in early 2023.
In an X post (formerly Twitter) on June 20, Rekt Capital highlighted that Bitcoin tends to form re-accumulation ranges post-halving. These ranges are characterized by low volatility and narrow trading corridors, setting the stage for the next significant move.
Picks for you
For Bitcoin to initiate a recovery, it must break its current pattern of forming lower highs. This recurring theme has delayed sustained upward momentum, suggesting that Bitcoin may remain range-bound for several more months.
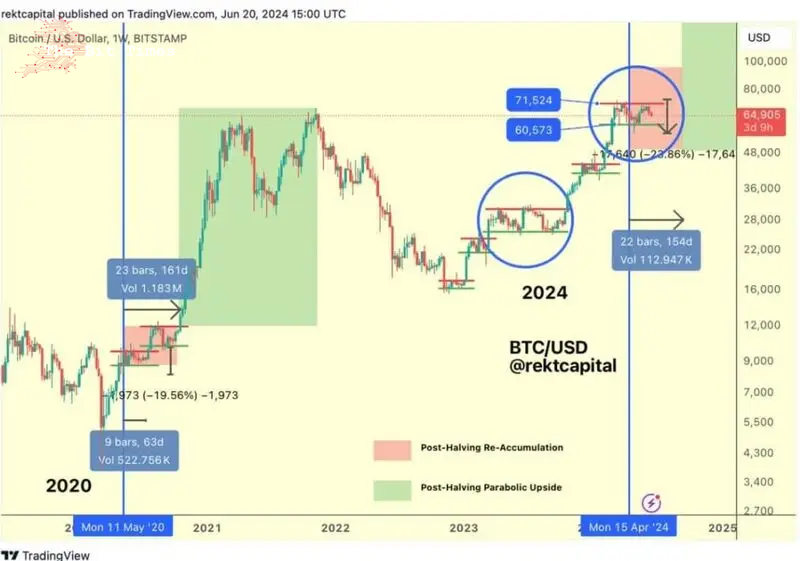
To understand this behavior, analysts drew parallels from historical patterns, particularly the bull markets of 2016 and 2020. In both years, Bitcoin formed re-accumulation ranges post-halving before breaking out significantly.
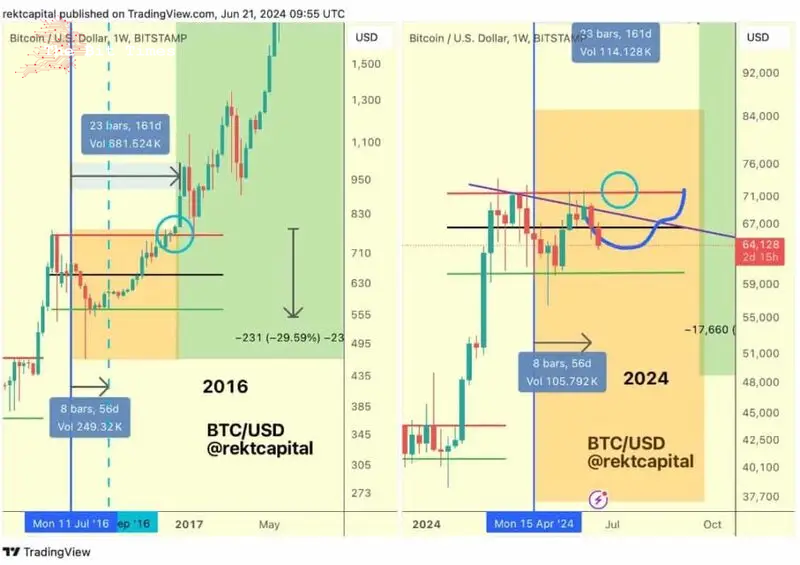
The 2020 graph shows Bitcoin’s price action post-halving, with a re-accumulation range followed by a parabolic upside. Bitcoin formed a strong support base before breaking out, reflecting a typical post-halving pattern. The 2024 graph indicates a similar potential for a breakout, aligning with historical behavior.
Miner activity and market sentiment
Interestingly, the re-accumulation phase is reflected not only in price but also in miner activity. There has been a significant shift in Bitcoin miners’ behavior, with miner reserves dropping to their lowest levels while over-the-counter (OTC) selling activity has surged.
Analyst Willy Woo commented that BTC might not see new highs until the current phase of miner capitulation and market boredom resolves, which historically precedes a significant rally.
Bitcoin price analysis
Bitcoin is changing hands at the price of $63,750, which suggests a decline of 3.53% in the last 24 hours, as well as a 4.84% drop across the previous seven days.
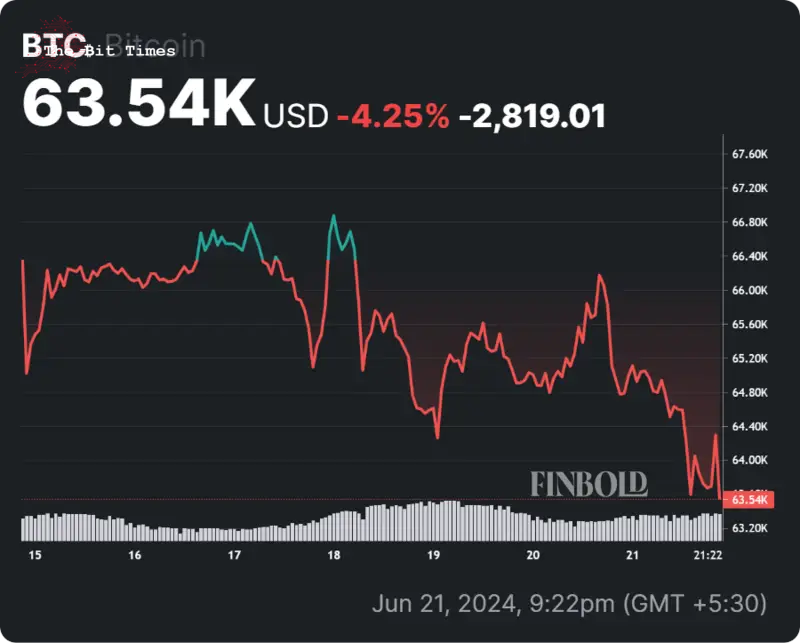
As of now, Bitcoin is consolidating above $63,000. The significant resistance at $70,000 has proven difficult to break, creating a narrow trading corridor. Support is firmly established at around $60,000, providing a cushion against potential declines.
The market sentiment is cautiously optimistic, with traders anticipating a breakout but preparing for continued consolidation.
Disclaimer: The content on this site should not be considered investment advice. Investing is speculative. When investing, your capital is at risk.
Comments
Post a Comment